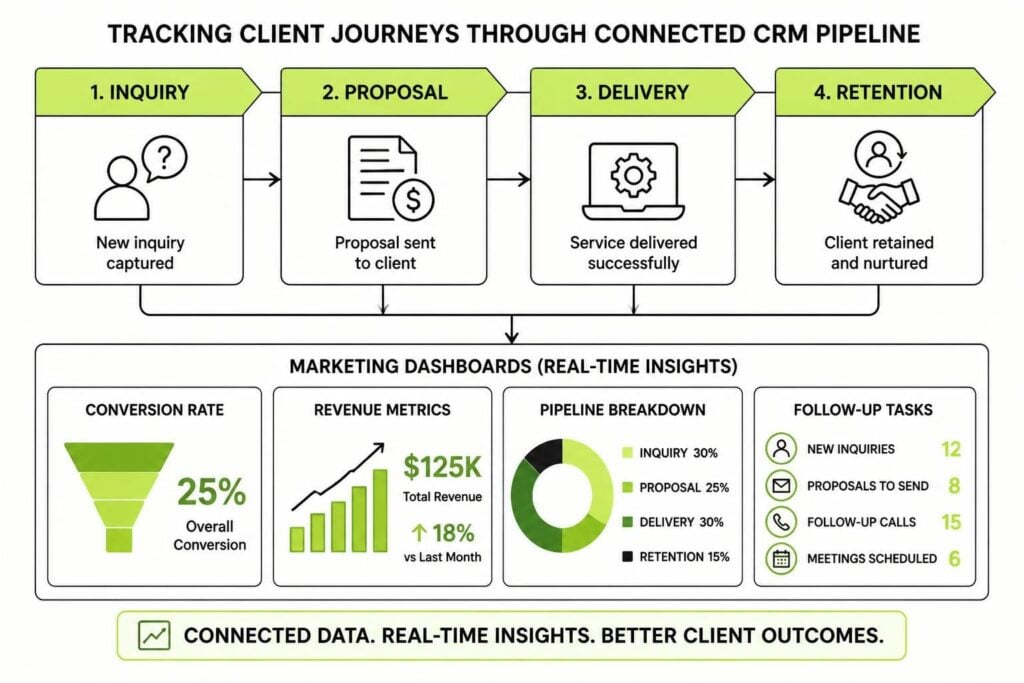
Most service businesses lose revenue in the space between getting a lead and closing the deal. Someone fills out a form, the follow-up gets delayed, the proposal sits unsigned, and three weeks later the opportunity is cold. It happens because there's no system watching the gaps. CRM pipelines and marketing dashboards for service businesses fix this problem by creating visibility into every stage of your client journey, from first contact to repeat purchase. When you can see where leads stall, which campaigns deliver quality prospects, and how long deals actually take to close, you can fix what's broken instead of guessing why revenue feels inconsistent.
Why Service Businesses Need Pipeline Visibility
Service businesses operate differently to product companies. You're not shipping widgets. You're selling expertise, time, and relationships. That means your sales cycle has more human touchpoints, longer decision windows, and greater variability in deal size and complexity.
Without a CRM pipeline, you're managing all of this in your head, across email threads, sticky notes, and scattered spreadsheets. It works until it doesn't. Then leads fall through cracks, follow-ups get missed, and you have no idea which marketing effort actually brought in the client who just signed.
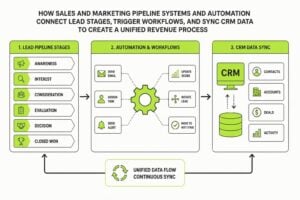
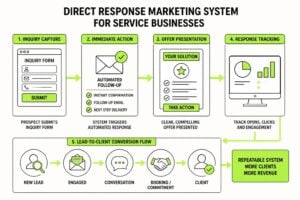
A pipeline structures this chaos. It gives every lead a stage, every stage a set of actions, and every action a deadline. When someone requests a quote, they enter your pipeline at "New Inquiry." When you send the proposal, they move to "Proposal Sent." When they sign, they hit "Won." If they go silent, they sit in "Stalled" until you decide to nurture or archive them.
This isn't about software for the sake of it. It's about protecting revenue by making sure nothing gets forgotten. Building a structured CRM pipeline around how you actually sell keeps your team aligned and your prospects moving forward.
What a Pipeline Actually Tracks
Here's what you should see in a properly built service business pipeline:
- Stage name: where the prospect currently sits in your process
- Contact details: name, email, phone, company
- Source: how they found you (organic search, referral, paid ad, event)
- Deal value: estimated project size or retainer amount
- Next action: what needs to happen next and who's responsible
- Last contact date: when you last touched base
- Expected close date: when you think this will convert or die
Each of these fields serves a purpose. Deal value lets you prioritise high-ticket opportunities. Source tells you which marketing channels are worth your budget. Next action prevents leads from going stale. Expected close date helps you forecast cash flow.
You don't need 47 custom fields. You need the handful that reflect how your business actually operates.
Building Dashboards That Surface Real Problems
A CRM without a dashboard is like a filing cabinet. It stores information, but it doesn't tell you what's happening. Dashboards turn your pipeline data into actionable insight by showing patterns, bottlenecks, and opportunities in real time.
The best dashboards for service businesses focus on a few core metrics:
| Metric | What It Reveals | Why It Matters |
|---|---|---|
| Conversion rate by stage | Where deals are dying | Helps you fix weak points in your process |
| Average deal size | Revenue potential per lead | Guides marketing spend and targeting |
| Time in stage | How long deals sit before moving | Identifies stalls and inefficiencies |
| Lead source performance | Which channels deliver quality | Tells you where to invest more budget |
| Pipeline value | Total potential revenue in play | Forecasts upcoming cash flow |
These metrics should update automatically as your pipeline changes. When a deal moves from "Proposal Sent" to "Won," your dashboard should reflect that immediately. No manual exports, no Friday afternoon data entry sessions.
Role-Based Dashboard Views
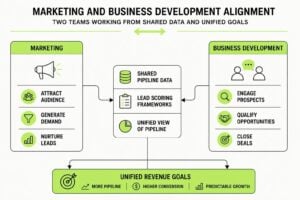
Not everyone needs to see the same data. Your sales team wants to know which deals need follow-up today. Your marketing team wants to see which campaigns are delivering qualified leads. You want to see revenue trends, win rates, and whether you're on track to hit this quarter's target.
Build dashboards for roles, not just reports. A salesperson's view might show their personal pipeline, tasks due today, and deals at risk of going cold. A marketer's view might show lead volume by source, cost per lead, and conversion rates from lead to qualified opportunity. Your executive view should show pipeline health, revenue closed this month, and forecast accuracy.
This keeps everyone focused on the metrics they can actually influence. Service-focused dashboards that align with team responsibilities drive better decisions than one-size-fits-all reports.
Automating Pipeline Movement and Follow-Up
Manual pipeline management doesn't scale. If you're relying on your team to remember when to follow up, update deal stages, or log activity, things will get missed. People get busy. Emails get buried. Leads go cold.
Automation fixes this by making the CRM do the remembering.
Workflow Triggers That Protect Leads
Here are workflows every service business should run:
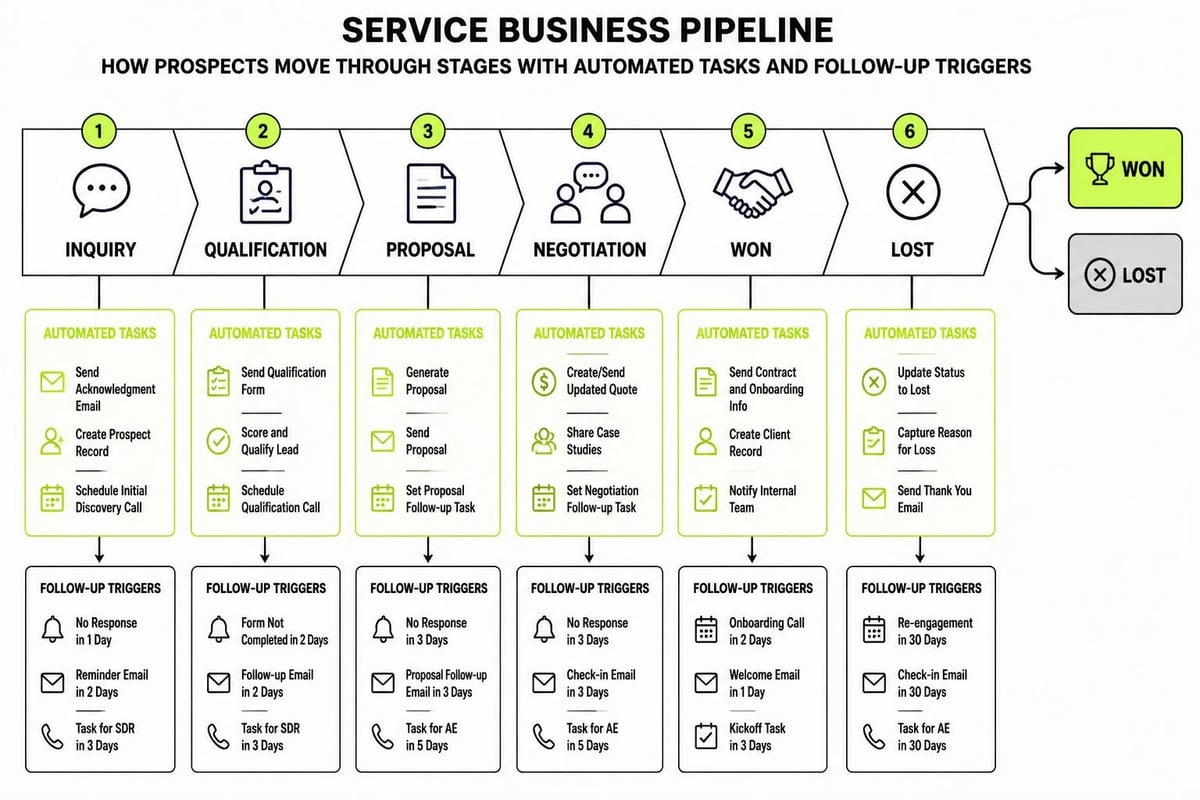
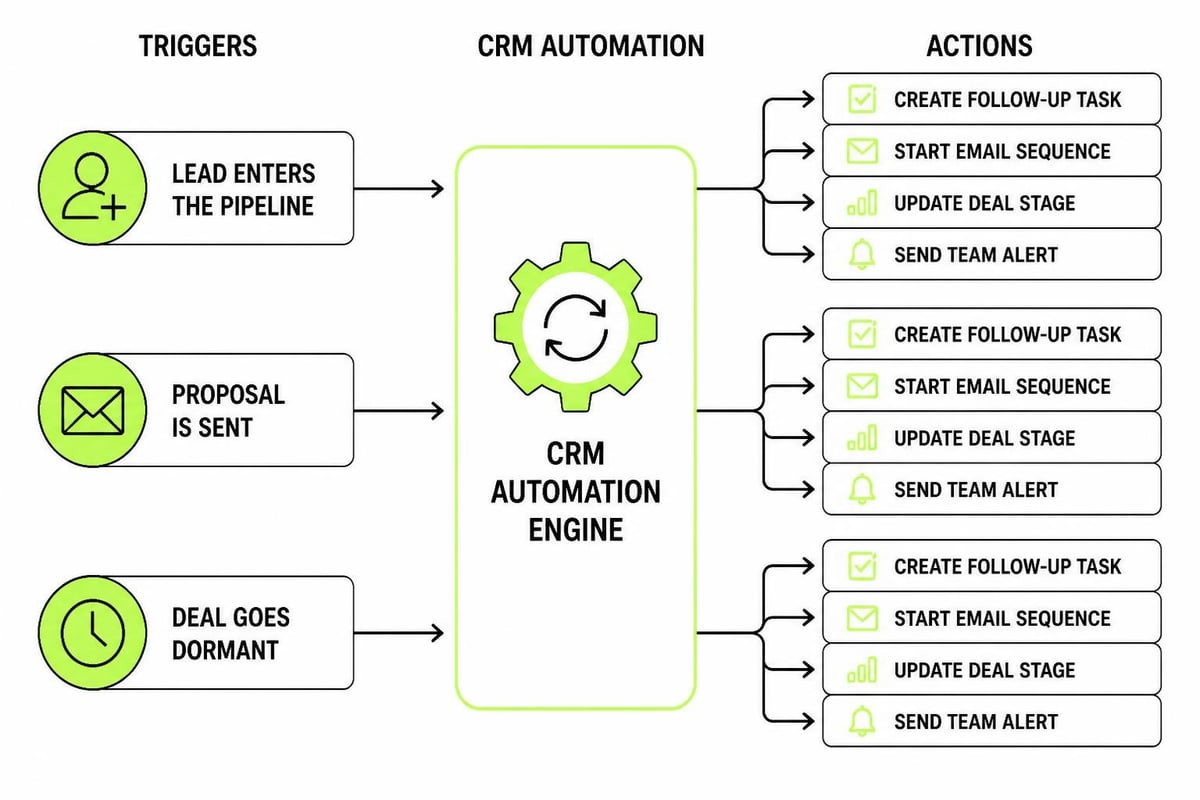
- New lead arrives (via form, email, or chat): CRM creates contact, assigns to sales rep, sends internal Slack notification, schedules first follow-up task for within 24 hours
- Proposal sent (deal stage changes): CRM logs activity, sets reminder to follow up in 3 days if no response, moves deal to "Awaiting Decision"
- Deal goes stale (no activity in 14 days): CRM flags deal as "At Risk," sends alert to manager, triggers re-engagement email sequence
- Deal won: CRM moves contact to client list, starts onboarding email sequence, creates delivery project in project management tool, updates revenue dashboard
- Deal lost: CRM archives deal, tags reason (price, timing, went with competitor), adds contact to long-term nurture campaign
These aren't complicated. They're just structured responses to predictable events. Automating your sales pipeline means leads get consistent treatment whether your team is slammed or slow.
Connecting Marketing Data to Pipeline Outcomes
Most marketing dashboards show vanity metrics. Website visits, social followers, email open rates. Those numbers feel good, but they don't tell you if marketing is actually creating revenue.
The real question is: which marketing activities turn into closed deals? That requires connecting your marketing data to your CRM pipeline.
When a lead comes in, your CRM should capture:
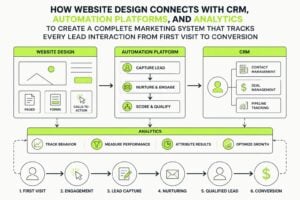
- First touch source: the very first way they found you (Google search, Facebook ad, podcast mention)
- Last touch source: what brought them back to convert (email campaign, retargeting ad, direct visit)
- Campaign name: if they clicked through from a specific campaign
- Landing page: which page they converted on
This attribution data lets you build dashboards that show marketing ROI in terms of actual revenue, not just activity.
Marketing Metrics That Matter
Here's what to track on a marketing dashboard that feeds into pipeline performance:
- Leads generated this month (total and by source)
- Lead-to-opportunity conversion rate (how many become real prospects)
- Opportunity-to-client conversion rate (how many close)
- Cost per lead by channel (ad spend divided by leads generated)
- Cost per client by channel (total spend divided by clients won)
- Revenue per marketing source (closed deal value attributed to each channel)
When you see that LinkedIn ads generated 23 leads last month but only 2 became clients, while referrals generated 8 leads and 5 became clients, you know where to shift your budget.
This is how CRM automation for service businesses creates operational visibility. You stop guessing and start measuring what actually drives growth.
Setting Up Stages That Match Your Actual Process
A generic pipeline template won't work. Your sales process isn't the same as a SaaS company's or a retail store's. You need stages that reflect the actual steps a prospect goes through when buying your service.
Start by mapping out what really happens:
- Inquiry: someone asks a question, requests info, or fills out a contact form
- Qualification: you have a discovery call to see if they're a fit
- Proposal: you send a detailed scope, timeline, and price
- Negotiation: they come back with questions, budget concerns, or scope changes
- Closed Won: they sign the agreement and pay the deposit
- Closed Lost: they go silent, choose a competitor, or decide not to proceed
Your stages might be different. Some service businesses add "Awaiting Approval" for deals that need sign-off from multiple stakeholders. Others add "Onboarding" as a post-sale stage to track delivery handoff.
The key is to design your pipeline around how you actually operate, not around what some software vendor thinks you should do.
Exit Criteria for Each Stage
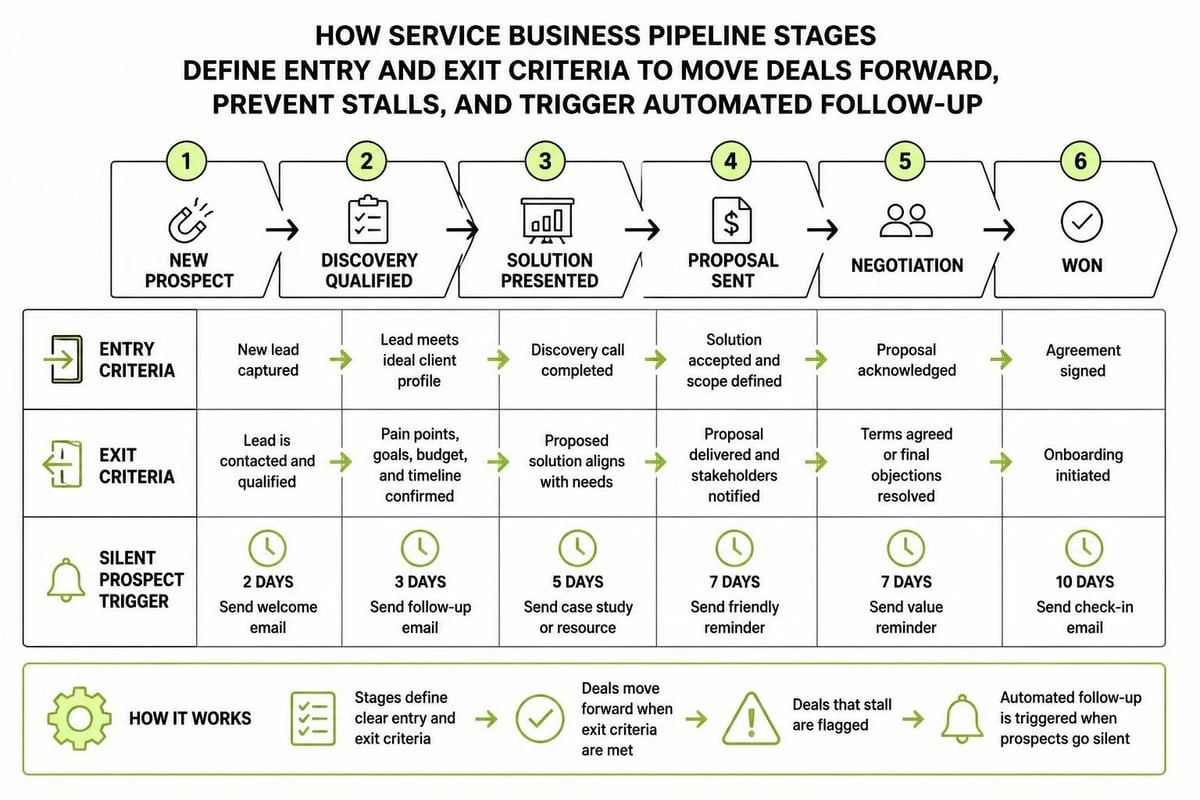
Every stage should have clear criteria for moving forward or backward. This prevents deals from sitting in limbo.
| Stage | Entry Criteria | Exit Criteria |
|---|---|---|
| Inquiry | Contact form submitted or inbound email received | Discovery call booked or disqualified |
| Qualification | Discovery call completed | Qualified as fit and proposal requested, or marked not a fit |
| Proposal | Scope and pricing sent | Prospect accepts, requests changes, or goes silent for 14 days |
| Negotiation | Prospect responded with questions or revisions | Agreement reached and contract sent, or deal marked lost |
| Closed Won | Contract signed and deposit received | N/A |
| Closed Lost | Prospect declined, went silent, or chose competitor | N/A |
This structure forces clarity. No deal gets stuck in "Proposal" for three months because someone forgot to follow up.
Tracking Lead Quality, Not Just Lead Volume
Generating 100 leads means nothing if none of them can afford your services or fit your ideal client profile. CRM pipelines and marketing dashboards for service businesses should help you measure quality, not just quantity.
Lead quality indicators include:
- Budget fit (can they actually afford what you offer?)
- Timeline fit (are they ready to move forward soon or just researching?)
- Authority fit (are you talking to the decision-maker?)
- Need fit (do they actually need your specific service?)
Build a qualification process that scores or tags leads based on these factors. High-quality leads get immediate follow-up and move faster through your pipeline. Low-quality leads get routed to nurture campaigns or archived.
Your marketing dashboard should show not just how many leads each channel generated, but how many qualified leads. If Facebook ads deliver 50 leads but only 3 are qualified, while organic search delivers 12 leads and 9 are qualified, you've learned something valuable about where to focus.
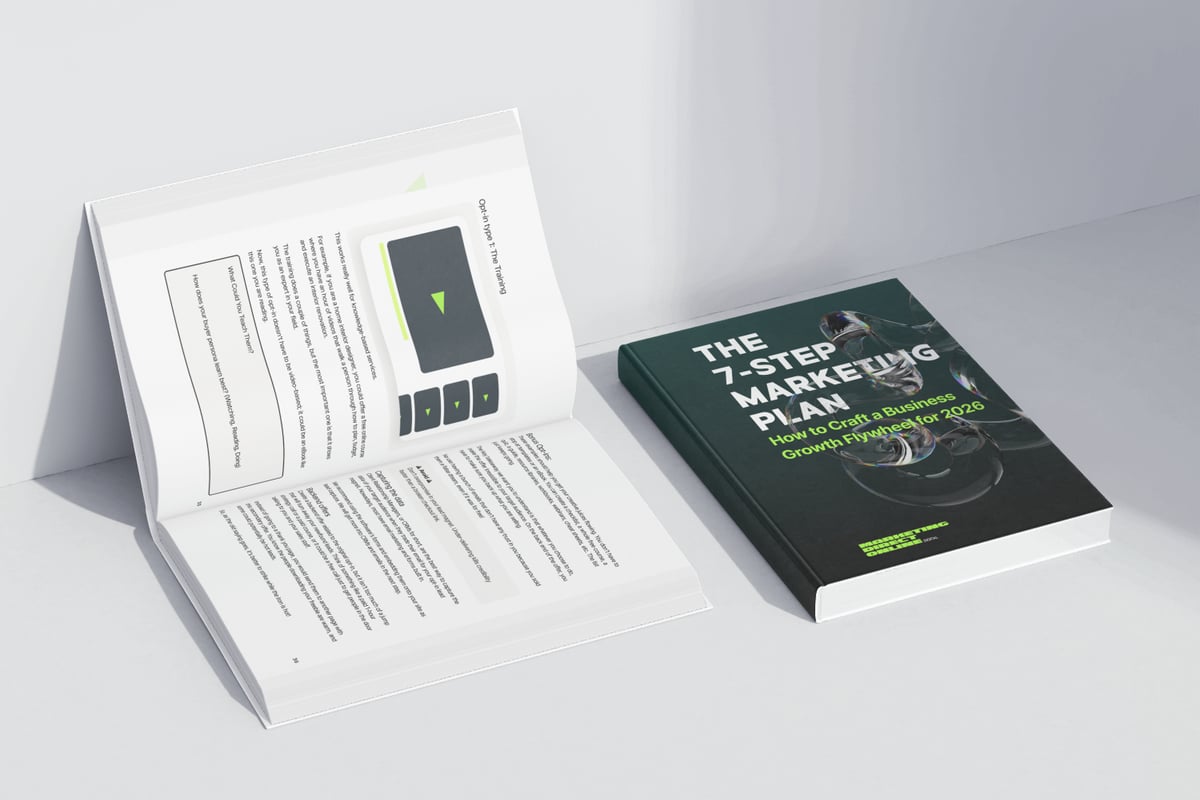
When you pair this with the 7-Step Marketing Plan framework, you create a complete system that attracts the right people, captures them properly, and moves them through a structured nurture process that builds trust before you ever get on a call. This alignment between marketing strategy and CRM infrastructure is what separates businesses that scale predictably from those that stay stuck chasing random leads.
Reporting That Drives Better Decisions
The point of crm pipelines and marketing dashboards for service businesses isn't to collect data. It's to make smarter decisions faster.
Good reporting answers specific questions:
- Are we on track to hit this month's revenue target?
- Which marketing channels are delivering the best ROI?
- Where are deals getting stuck in our pipeline?
- How long does it actually take to close a new client?
- Which services or package types convert best?
- What's our win rate by lead source?
Set up weekly pipeline reviews where you and your team look at these metrics together. Identify bottlenecks. Celebrate wins. Adjust tactics based on what the data is telling you.
If your average time from inquiry to closed deal is 47 days, but deals from referrals close in 23 days while deals from cold outreach take 68 days, that should change how you allocate resources.
If your proposal-to-close rate is 65% for clients who've attended a workshop but only 22% for those who just filled out a contact form, maybe you need more workshops.
The dashboard doesn't make the decision for you. It just makes the right decision obvious.
Avoiding Dashboard Overload
It's tempting to track everything. Thirty different metrics, colour-coded charts, pivot tables that slice data seventeen ways. Don't.
Too much information is the same as no information. You look at a cluttered dashboard, feel overwhelmed, and make no changes.
Stick to 5-7 core metrics per dashboard. If you need more detail, create separate views for deep dives, but your default dashboard should tell you in 30 seconds whether things are healthy or broken.
For most service businesses, that means:
- Total pipeline value
- Number of active opportunities
- Conversion rate by stage
- Average deal size
- Average days in pipeline
- Revenue closed this month vs target
- Top 3 lead sources by volume and by revenue
Everything else is noise until you've mastered these basics.
Dashboard Refresh Frequency
Your dashboard should update automatically, but you don't need to check it every hour. Set a rhythm:
- Daily: sales team checks their personal pipeline and today's tasks
- Weekly: leadership reviews overall pipeline health, conversion trends, and forecasts
- Monthly: full marketing attribution analysis, channel performance, and budget reallocation decisions
This prevents both dashboard addiction (constantly refreshing instead of doing the work) and dashboard neglect (building a system you never actually use).
Common Mistakes Service Businesses Make
Even with the best CRM and dashboards in place, service businesses often trip over the same issues.
Mistake 1: Not updating the CRM consistently. If your team only logs activity when they remember, your data is garbage and your dashboards are useless. Make CRM hygiene part of the process, not an afterthought.
Mistake 2: Building stages around software defaults, not your actual workflow. The stages that came with your CRM were designed for generic businesses. Customise them.
Mistake 3: Tracking too many metrics and acting on none of them. Pick the vital few. Ignore the rest until those are dialled in.
Mistake 4: No accountability for follow-up. Automation helps, but someone still needs to own each deal. Assign clear ownership and check in regularly.
Mistake 5: Treating the CRM as a reporting tool instead of a sales tool. Your team should live in the CRM because it makes their job easier, not just because you want pretty charts. If it's not helping them close more deals, fix that first.
Integrating CRM with the Rest of Your Stack
Your CRM shouldn't be an island. It needs to talk to your other tools so data flows automatically and nothing gets duplicated.
Common integrations for service businesses:
- Email platform (for campaign tracking and lead nurturing)
- Calendar tools (for booking discovery calls and tracking meeting outcomes)
- Proposal software (to log when proposals are sent, viewed, and signed)
- Project management (to kick off delivery once a deal closes)
- Accounting software (to sync invoices and payments with deal records)
- Website forms (to capture leads directly into the CRM without manual entry)
When these systems connect, the CRM becomes your single source of truth. You can see a client's entire journey in one place, from the blog post they first read, to the discovery call they booked, to the project you delivered, to the invoice they paid.
That visibility makes it easier to spot patterns, personalise outreach, and deliver a better client experience. If you're transitioning from spreadsheets to a CRM, integrations are what make the effort worthwhile.
What Good Looks Like in 2026
A well-functioning CRM pipeline and marketing dashboard setup in 2026 looks like this:
- New leads flow into your CRM automatically from every source (website, social, referrals, ads)
- Each lead gets assigned, tagged by source, and given a follow-up task within minutes
- Your team sees exactly what needs to happen next without checking three different tools
- Proposals get logged and tracked, so you know what's pending and what went cold
- When deals close, onboarding starts automatically and revenue gets recorded accurately
- Your marketing dashboard shows which efforts are actually driving revenue, not just traffic
- You can forecast next month's revenue with reasonable accuracy because your pipeline data is clean
This isn't science fiction. It's just structured systems that remove operational chaos and protect every lead from inquiry to close.
Most service businesses are closer to this than they think. They just need to stop tolerating the gaps, commit to a real CRM process, and build dashboards that surface what matters.
When you can see your entire client journey in one system, and measure what's working in real time, growth stops feeling random. CRM pipelines and marketing dashboards for service businesses turn scattered activity into structured systems that protect leads, surface bottlenecks, and create predictable revenue. If you're ready to remove the chaos and build marketing infrastructure that actually compounds, MDO Digital helps service businesses design the systems, automation, and reporting that turn attention into demand.